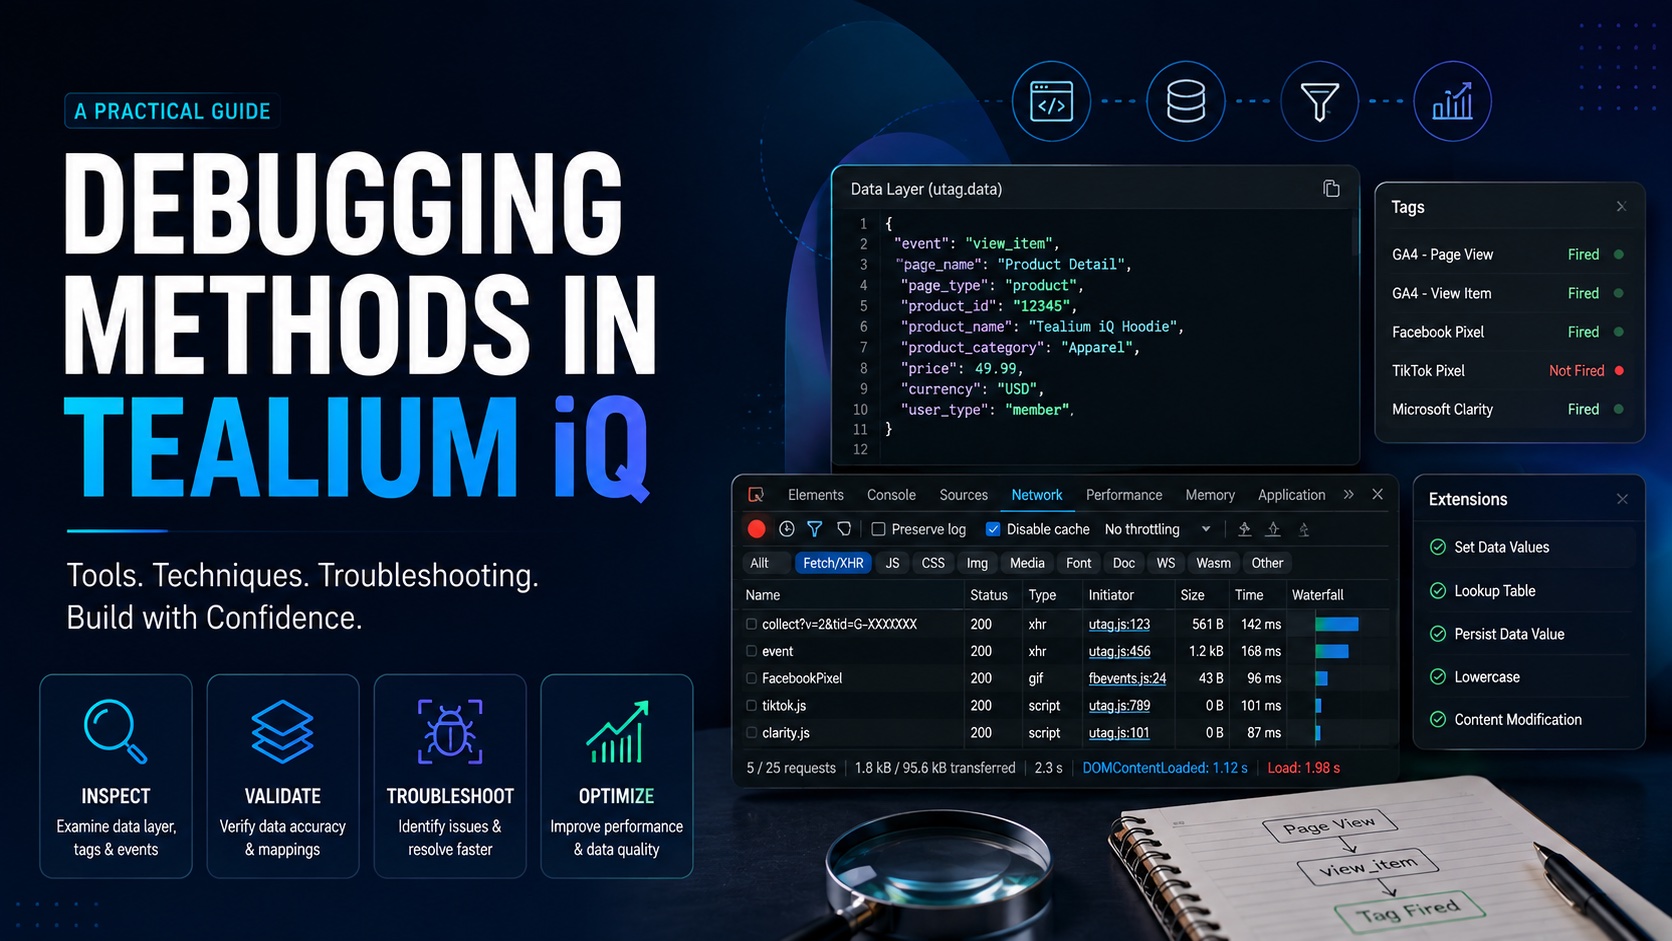
Effective Debugging Methods in Tealium iQ: A Practical Guide

A robust tag management system can greatly simplify the deployment and maintenance of analytics and marketing technologies, but ensuring accurate data collection requires ongoing validation and troubleshooting. Even in well-structured Tealium iQ implementations, issues such as tags not firing, missing events, incorrect variable mappings, or unexpected data values can impact reporting accuracy and business decision-making.

Effective debugging is therefore a critical skill for developers, analysts, and implementation specialists working with Tealium iQ. By understanding how data flows through the platform and leveraging the right debugging tools, teams can quickly identify issues, validate configurations, and maintain confidence in their tracking setup.

In this guide, we’ll explore practical and proven debugging methods in Tealium iQ, covering everything from data layer validation and load rule analysis to browser developer tools and Tealium Trace. Whether you’re troubleshooting a simple tagging issue or diagnosing a complex tracking problem, these techniques will help you resolve issues more efficiently and ensure reliable data collection.

Understanding How Tags Work in Tealium iQ

Before diving into debugging techniques, it’s helpful to understand how Tealium iQ processes data and executes tags. A clear understanding of the tag execution flow can make it much easier to identify where an issue is occurring and why a tag may not be firing as expected.

When a visitor loads a webpage, Tealium follows a series of steps to collect, process, and distribute data to third-party platforms:

  1. The Tealium Universal Tag (utag.js) loads on the page.

  2. Data is collected into the Universal Data Object (UDO), which serves as the central data layer for Tealium.

  3. Extensions execute based on their configured scope and execution order, allowing data to be modified, enriched, or transformed.

  4. Load rules are evaluated to determine which tags should be allowed to fire.

  5. Eligible tags are triggered according to the configured conditions.

  6. Vendor-specific requests are sent to analytics, advertising, or marketing platforms with the mapped data.

The process can be visualized as:

Page Loads → Data Layer Populated → Extensions Execute → Load Rules Evaluated → Tags Fire → Data Sent to Vendors

Understanding this sequence is crucial because a failure at any stage can prevent a tag from executing correctly. For example, if a required data layer variable is missing, an extension may not function as intended. Similarly, if a load rule evaluates to false, the associated tag will never fire, even if the tag configuration itself is correct.

When debugging in Tealium iQ, the goal is to identify where in this workflow the breakdown occurs. By systematically validating each stage from data collection to tag execution you can quickly isolate issues and resolve them with confidence.

Why Debugging Matters in Tealium iQ

A successful Tealium iQ implementation goes beyond simply deploying tags—it ensures that accurate and reliable data reaches analytics, marketing, and personalization platforms. Since business decisions often rely on this data, even minor tracking issues can lead to inaccurate reporting, flawed insights, and missed opportunities.

Whether you’re implementing a new vendor tag, updating a data layer, or configuring complex extensions, issues can arise at any stage of the data collection process. Common challenges include tags failing to fire, incorrect variable mappings, load rule conflicts, and extension execution errors. Left unresolved, these problems can compromise data quality.

Common challenges include tags failing to fire, incorrect variable mappings, missing tracking parameters, load rule conflicts, and extension execution errors. Left unresolved, these problems can compromise data quality and make troubleshooting increasingly difficult as implementations grow in complexity.

A structured debugging approach helps teams quickly identify the root cause of issues, validate tracking behavior, and ensure data is being collected as intended. By leveraging Tealium iQ’s built-in tools alongside browser developer tools, analysts and developers can reduce troubleshooting time, improve implementation reliability, and maintain confidence in the accuracy of their data.

Some of the most common issues encountered in Tealium iQ include:

  • Tags not firing when expected

  • Missing or incorrect data layer values

  • Improper variable mappings

  • Load rule conflicts

  • Extension execution failures

  • Vendor-specific implementation errors

  • Duplicate or inconsistent tracking events

Understanding how to efficiently diagnose and resolve these issues is essential for maintaining a healthy and scalable tagging infrastructure.

Common Symptoms of Tag Firing Issues

Before starting the debugging process, it’s important to recognize the signs of a potential tracking problem. Tag firing issues can manifest in different ways depending on the affected platform, implementation, or business use case. Identifying these symptoms early can help narrow down the root cause and accelerate troubleshooting.

Some of the most common indicators of tag-related issues include:

  • Analytics events are missing from reports.

  • Marketing or advertising pixels are not visible in network requests.

  • Conversion tracking is incomplete or not recorded

  • Audience segments are not populating as expected.

  • Retargeting campaigns fail to capture users.

  • Tracking works correctly in one environment but not in another.

  • Tags fire on certain pages but fail on others.

  • Data layer variables appear blank, incorrect, or inconsistent.

  • Custom dimensions or attributes are not being populated in vendor platforms.

  • Unexpected discrepancies appear between different analytics tools.

These symptoms often point to underlying issues within the data layer, load rules, extensions, consent configurations, tag mappings, or vendor-specific settings. Understanding the symptoms before diving into technical troubleshooting can help you focus your investigation on the most likely areas of concern.

In the following sections, we’ll explore practical debugging techniques that can help you identify and resolve these issues efficiently within Tealium iQ.

The Business Impact of Tag Failures

Tag failures are often viewed as technical issues, but their impact extends far beyond implementation teams. When tracking data is incomplete or inaccurate, it can affect reporting, marketing performance, customer insights, and even regulatory compliance. Understanding the business consequences of tag failures highlights why proactive debugging is so important.

1. Data Loss

When analytics or marketing tags fail to fire, valuable user interactions may never be recorded. This results in gaps within reporting platforms and can lead to an incomplete understanding of customer behavior.

Example: If a purchase confirmation tag fails to execute, revenue and conversion data may not be captured, leading to underreported sales figures.

2. Inaccurate Reporting

Business leaders rely on analytics data to evaluate performance and make strategic decisions. Missing or incorrect tracking data can produce misleading reports and reduce confidence in analytics.

Common consequences include:

  • Underreported conversion rates

  • Incorrect traffic source attribution

  • Missing campaign performance metrics

  • Inaccurate customer journey analysis

3. Marketing Audience and Personalization Issues

Many advertising and personalization platforms depend on tracking tags to build audiences and activate campaigns. When tags fail, audience qualification can become incomplete or inaccurate.

Potential impacts include:

  • Smaller retargeting audiences

  • Inaccurate customer segmentation

  • Reduced personalization effectiveness

  • Lower campaign performance

4. Revenue Attribution Challenges

Organizations often use tracking data to determine which channels, campaigns, or marketing initiatives contribute to revenue. Missing tracking events can make attribution models unreliable and lead to poor investment decisions.

As a result, marketing budgets may be allocated to underperforming channels while high-performing initiatives go unnoticed.

5. Compliance and Privacy Risks

Modern implementations frequently rely on consent management and privacy-related tags to support regulatory requirements. If these tags do not fire correctly, organizations may face compliance challenges.

Potential risks include:

  • Missing consent records

  • Incomplete privacy preference tracking

  • Regulatory compliance concerns

  • Increased exposure to privacy-related violations

These business impacts demonstrate why debugging should not be treated as a reactive activity. A proactive approach to monitoring and troubleshooting Tealium iQ implementations helps ensure data accuracy, supports informed decision-making, and protects both marketing performance and compliance objectives.

Debugging Approaches in Tealium iQ

It’s important to understand that debugging in Tealium isn’t limited to a single tool. Since Tealium processes data through multiple stages such as the data layer, extensions, load rules, tags, and vendor requests you’ll often need to use different debugging techniques depending on where the issue occurs.

For example:

  • If a variable is missing, you’ll inspect the data layer.

  • If an extension isn’t executing, you’ll debug the extension scope and execution order.

  • If a tag isn’t firing, you’ll investigate the load rule.

  • If the tag fires but the vendor doesn’t receive the expected data, you’ll inspect the network request.

  • If you’re debugging server-side events, Tealium Trace is the preferred tool.

Rather than relying on a single method, experienced Tealium developers follow a structured debugging process, moving through each stage of the execution flow until the root cause is identified.

1. Verify that utag.js is loading

Before investigating load rules, extensions, or data layer values, the first step is to confirm that Tealium is actually loading on the page. Every Tealium iQ implementation starts with the utag.jsfile, which acts as the entry point for loading the data layer, evaluating load rules, executing extensions, and triggering tags.

If utag.jsfails to load, none of the configured tags or extensions will execute, making this the most important initial check during debugging.

How to Verify utag.js

  1. Open your website in the browser.

  2. Press F12 (Windows/Linux) or Cmd + Option + I (macOS) to open the browser’s Developer Tools.

  3. Navigate to the Network tab.

  4. Refresh the page.

  5. In the filter box, search for:

utag.js

If Tealium is loading correctly, you should see a request similar to:

https://tags.tiqcdn.com/utag/{account}/{profile}/{environment}/utag.js

A successful request (typically with a 200 status code) confirms that Tealium has been loaded successfully and can continue processing the page.

What if utag.js is Missing?

If you don’t see a request for utag.js, it indicates that Tealium has not been loaded. Some common causes include:

  • The Tealium script has not been implemented on the page.

  • The page is pointing to an incorrect environment or profile.

  • Recent code changes accidentally removed the Tealium snippet.

  • A Content Security Policy (CSP) is blocking the request.

  • A browser extension, such as an ad blocker or privacy tool, is preventing the script from loading.

  • A JavaScript error occurring earlier on the page is interrupting execution.

Until utag.js loads successfully, there is little value in checking load rules, extensions, or tag mappings, as none of these components can execute without the Tealium library.

Once you’ve confirmed that utag.js is loading correctly, the next step is to verify that you’re testing the correct Tealium environment and that the expected version of your implementation has been published.

2. Verify the Correct Environment

Before diving into debugging, make sure you’re testing the correct Tealium environment.

  • Verify whether you’re testing Dev, QA, or Prod.

  • Confirm that the correct utag.jsfile is loading.

  • Check that your latest changes have been saved and published to the environment you’re testing.

A common issue is testing an older published version while expecting newly added changes.

3. Inspect the Universal Data Object (UDO)

Every tag depends on the data available in the Universal Data Object.

In the browser console, inspect the data:

utag.data

Verify that:

  • Required variables exist.

  • Variable names are correct.

  • Values are populated as expected.

  • Data types are correct.

Missing or incorrect variables frequently prevent load rules from evaluating successfully.

4. Validate Load Rules

After confirming that the required data is available in the Universal Data Object (UDO), the next step is to verify whether the tag’s Load Rule is evaluating correctly.

Load Rules determine whether a tag is eligible to fire. Even if the tag configuration and mappings are correct, the tag will not execute if the Load Rule conditions are not satisfied.

For example, consider a Load Rule:

page_type equals “product”

If the data layer contains:

utag.data.page_type = “product”

the condition passes and the tag can fire.

However, if the value is:

utag.data.page_type = “Product”

the condition may fail because the value does not exactly match the configured rule.

When validating Load Rules, check:

  • Are all required variables available in utag.data?

  • Do the variable values exactly match the expected conditions?

  • Are AND/OR conditions configured correctly?

  • Is the Load Rule assigned to the correct tag?

Common Load Rule issues include:

  • Missing data layer variables

  • Incorrect capitalization or spelling

  • Unexpected values from the website

  • Incorrect rule logic

  • Testing against an outdated published version

You can use the browser console to verify the data:

utag.data

You can also enable Tealium debugging:

document.cookie=”utagdb=true”;

to view whether tags are loading or being skipped due to Load Rule conditions.

If a tag is not firing, always confirm the Load Rule first before investigating the tag configuration itself. Many tag firing issues are caused by conditions not being met rather than a problem with the tag.

5. Debug Extensions

After validating Load Rules, the next step is to check whether Tealium Extensions are working as expected. Extensions are used to modify, enrich, or transform data before it is passed to tags and vendor platforms.

A tag may have the correct configuration, and the Load Rule may evaluate successfully, but an extension issue can still cause incorrect data to be sent or prevent the expected behavior.

Common extension-related issues include:

  • Extension is not executing.

  • Incorrect extension scope.

  • Incorrect execution order.

  • Data being overwritten by another extension.

  • JavaScript errors inside custom extensions.

  • Extension logic not matching the current page or event conditions.

What to Check When Debugging Extensions
a. Verify Extension Scope
The scope determines when an extension executes during the Tealium processing flow.

Common scopes include:

  • Before Load Rules

  • After Load Rules

  • Tag Scoped

  • DOM Ready

The scope is important because an extension may run before or after certain Tealium processes.

For example, if an extension creates a variable that is required for a Load Rule, but the extension runs after Load Rules are evaluated, the tag may not fire because the required data is not available at the right time.

b. Check Extension Execution Order

When multiple extensions modify the same variable, the execution order can affect the final value.

Example:

Extension 1:

page_type = “product”;

Extension 2:

page_type = “category”;

In this case, the final value depends on which extension runs last.

Always verify the order of extensions when the data being sent does not match the expected value.

c. Debug JavaScript Extensions

Custom JavaScript Extensions can introduce errors that prevent data from being processed correctly.

Use console logging to check the values available inside an extension.

Example:

console.log(“Current Page Type:”, b.page_type);

Expected output:

Current Page Type: product;

If the output is:

Current Page Type: undefined;

the issue may be with the data layer or the extension logic.

Tools to Debug Extensions

You can use the following tools to troubleshoot extension issues:

Browser Console

Check the available data:

utag.data

This helps verify whether the extension is creating or modifying the expected variables.

Tealium Debug Mode

Enable Tealium debugging:

document.cookie=”utagdb=true”;

This provides additional information about Tealium execution, including tag loading and extension behavior.

Tealium Web Companion / Tealium Tools

These tools help review the implementation flow and identify whether extensions are executing as expected during page loads and events.

Extensions can change the data before it reaches a tag. If a tag is not firing or the vendor receives unexpected values, always verify whether an extension is modifying, removing, or creating the data incorrectly.

6. Using Browser Developer Tools

The browser’s Developer Tools are one of the most powerful debugging resources when troubleshooting Tealium iQ implementations. Before making changes in Tealium iQ, many issues can be identified directly from the browser by inspecting data, scripts, HTML elements, and network requests.

To open Developer Tools:

  • Windows/Linux: F12 or Ctrl + Shift + I

  • macOS: Cmd + Option + I

You’ll mainly use four tabs:

  • Elements

  • Console

  • Network

  • Sources

Each tab helps investigate a different part of the tracking process. The Console helps validate data and JavaScript execution, the Network tab confirms whether requests are being sent, the Elements tab helps debug page interactions, and the Sources tab helps troubleshoot JavaScript execution.

a. Console Tab

The Console allows you to inspect Tealium objects, validate variables, and identify issues while the page is running.

For example, type:

utag

You’ll see the complete Tealium object.

Now inspect the data layer.

utag.data

Example output:

{
  page_name: "Home",
  page_type: "Landing",
  user_type: "Guest",
  country: "India"
}

The Console allows you to verify the current Tealium state, inspect variables, and identify missing or unexpected values during debugging.

If instead you see:

page_name: undefined

it indicates that the variable is not available at that point in the data layer and needs further investigation.

i. Checking Individual Variables

Instead of viewing the whole object, inspect a single variable.

utag.data.page_name

Output:

Home

or

Undefined

This is useful when troubleshooting a specific variable used in:

  • Load Rules

  • Extensions

  • Tag mappings

  • Vendor parameters.

ii. Checking the Current Event Object

Inside JavaScript Extensions, Tealium stores event data in a variable called b.

Example:

console.log(b);

Output:

{ page_name:"Home", page_type:"Landing", cart_total:150 }

This shows the exact data available to the extension at the time it executes.

If a value is missing here, the issue may be related to the data layer or the timing of when the extension runs.

iii. Console Logging


When working with custom JavaScript Extensions, adding console logs can make troubleshooting much easier.

Instead of writing complex logic without visibility:

if(b.page_type=="checkout"){ ... }

Add logging.

console.log("Current page:", b.page_type);

Output

Current page: checkout

This helps confirm whether your conditions are receiving the expected values.

b. Debugging Network Requests


The Network tab helps answer one of the most important debugging questions:

“Did the analytics request actually leave the browser?”

The Network tab answers this.

To open Network:

  1. Open Developer Tools.

  2. Select the Network tab.

  3. Refresh the page.

  4. Search for relevant requests.

Checking Tealium Files


Before checking vendor requests, verify that Tealium files are loading correctly.

Search for:

utag

You’ll see requests like

utag.js utag.sync.js utag.12.js utag.45.js

These files indicate that Tealium and the required tag templates are loading on the page.

Check the status code:

  • 200 → Request loaded successfully.

  • 404 → File not found.

  • Blocked/Failed → Browser, security policy, or network issue may be preventing loading.

i. Verifying Vendor Requests


After confirming Tealium is loading, search for vendor-specific requests.

For Google Analytics 4, search:

collect

For Google Analytics 4, you’ll see something similar to:

https://www.google-analytics.com/g/collect

Click the request.

Open

Headers

You’ll see parameters such as

page_location page_title client_id session_id event_name

If one of these values is missing, you know the issue is before the request reaches Google Analytics.

Example


Suppose your business expects:

event_name = purchase

Instead you see

event_name = page_view

Now you know:

The request was sent correctly.

The issue is not Google Analytics.

Instead, investigate:

  • Event mapping

  • Extension logic

  • utag.link()

  • utag.view()

c. Elements Tab


The Elements tab allows you to inspect the actual HTML structure of the webpage. This is especially useful for debugging interaction-based tracking such as:

  • Button clicks

  • Form submissions

  • Downloads

  • Custom event tracking

Many Tealium implementations depend on specific HTML elements, IDs, classes, or attributes. If the website structure changes, tracking logic based on those elements may stop working.

How to Inspect an Element

 
  1. Open the webpage.

  2. Right-click the element you want to test.

  3. Select Inspect.

  4. Chrome DevTools will highlight the HTML element.

Check:

  • Does the element have the expected ID?

  • Has the class name changed?

  • Are required data attributes available?

  • Is the element dynamically created?

  • Has the page structure changed?

Example:

Original button:

<button id="buy-now">Buy Now</button>

After a website update:

<button id="purchase-btn">Buy Now</button>

Although the button looks the same to users, the tracking logic may fail because the selector no longer matches the updated element.

Checking Event Listeners


You can also verify whether events are attached to an element.

In the Elements tab:

  1. Select the element.

  2. Open Event Listeners.

  3. Expand events such as:

    • click

    • submit

    • change

If the expected listener is missing, the issue may be related to the website implementation or JavaScript logic rather than Tealium configuration.

d. Sources Tab


The Sources tab is useful when debugging custom JavaScript, Tealium Extensions, or complex tracking logic.

It allows you to:

  • Search JavaScript files.

  • Add breakpoints.

  • Pause execution.

  • Inspect variable values while code is running.

For example, if a JavaScript Extension is not setting a variable correctly, you can:

  1. Open the Sources tab.

  2. Find the relevant JavaScript code.

  3. Add a breakpoint.

  4. Reload the page.

  5. Check how the code executes step by step.

This is especially helpful when debugging:

  • Custom JavaScript Extensions

  • Complex event tracking

  • Data transformation logic

  • Unexpected variable values

Browser Developer Tools help you identify where the tracking process is failing. The Console helps validate data, the Network tab confirms whether requests are sent, the Elements tab helps troubleshoot user interactions, and the Sources tab helps debug JavaScript execution.

Using these tools together allows you to determine whether the issue is with the website data layer, Tealium configuration, JavaScript logic, or the final vendor request.


Whether you’re evaluating client-side tracking, server-side tracking, or a hybrid approach, Dexata helps enterprise marketing teams identify the right measurement strategy for their business. Get in touch to learn how we can help improve data quality, attribution, and marketing insights.

Get Your MarTech Value Audit

Identify underutilised capabilities and high-impact optimisation opportunities.

About The Author

Picture of Krishna
Krishna

Results-driven MarTech Specialist with a strong passion for leveraging data to optimize customer journeys and marketing outcomes. Proficient in Tealium iQ and AudienceStream, excelling at tag management, real-time audience segmentation, and unified data strategy. Experienced in delivering actionable analytics, orchestrating personalized campaigns, and connecting cross-channel insights to boost digital growth. Dedicated to bridging marketing and technology with a commitment to privacy and measureable innovation

Picture of Rohit Chauhan
Rohit Chauhan

Results-driven MarTech Consultant with over 5 years of experience in digital analytics, data collection, and customer data activation. Skilled in Google Analytics, Google Tag Manager, Server-Side Tracking, CAPI, Tealium iQ, OneTrust, Consent Mode, and CDP implementations, with a strong focus on building reliable data ecosystems. Experienced in web and app tracking, reporting, and translating complex datasets into actionable insights that drive business growth, improve customer experiences, and support privacy-first marketing strategies

Connect with Krishna
Connect with Rohit

What do you think?

Leave a Reply

Your email address will not be published. Required fields are marked *

What to read next

Leave a Reply

Your email address will not be published. Required fields are marked *

top
Adobe

Adobe Analytics
Adobe Target
Adobe Audience Manager
Adobe Experience Manager
Adobe Campaign Manager
Adobe Real-Time CDP

Google

Google Analytics (GA4)
Google Analytics (360)
Google Optimize
Google Tag Manager

Tealium

Tealium AudienceStream CDP
Tealium EventStream
Tealium IQ

Segment
Quantum Metric
MoEngage
CleverTap
MixPanel
OneTrust
Playrcart
VWO
Optimizely